Dashboards of KPI numbers, charts and lists from any Odoo model, filtered by period and company, with a click through to the records behind every number.
Managers want their numbers on one screen: revenue this month against last month, the pipeline by stage, late transfers, overdue invoices. KPI Dashboards lets you build such dashboards from tiles on any model and comes with ready-made dashboards for Sales, CRM, Inventory and Invoicing. Every number is computed with the viewer's own access rights, so one dashboard can be shared with a whole team.
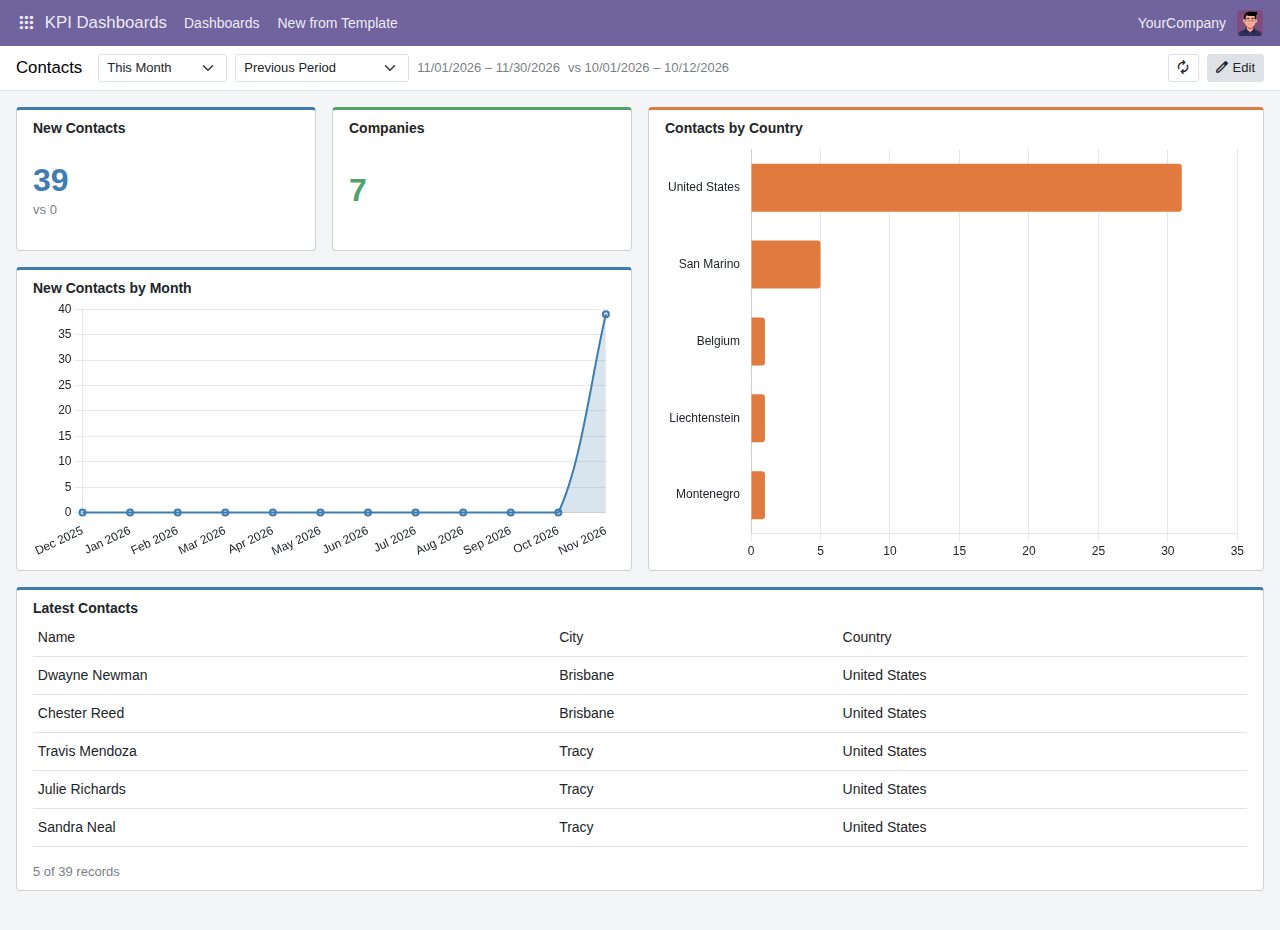
Count, sum, average, minimum or maximum of any stored number field, against the previous period or the same period last year, with the change in percent. For numbers where less is better, such as lost opportunities, a decrease shows in green.
Group by a linked record (such as customer or stage), a selection, a yes/no or a text field, or a date by day, week, month, quarter or year. Periods without records show as zero, and a long range shows its newest 400 bars; for counts and sums, everything beyond the largest groups is added up as Others.
Show the first records of a model in the order you choose, with the columns you pick in the order you pick them, and the total number of records found. Columns are stored fields that you may read, and a viewer sees only the columns they may read.
A click on a number, a bar or a slice opens exactly the records behind it, and so does the previous period's number; a click on a list row opens that record.
Choose today, this week, month, quarter or year, the last 7 or 30 days, last month, quarter or year, the last 12 months, a custom range or all time; dates follow the viewer's time zone, and weeks start on the first day of the viewer's language. The company filter offers only the companies the viewer works in. A trend tile can keep a period of its own, such as the last 12 months.
Add, change and remove tiles in a side panel with model and field pickers and Odoo's filter editor. Drag a tile to move it and pull its corner to resize it on a 12-column grid; the layout is saved at once.
Share a dashboard with user groups. Numbers are computed with the viewer's access rights, so record rules and company rules apply, and a tile on a model the viewer cannot read says so instead of showing numbers. Only the owner and KPI managers can change a dashboard and its tiles, and only KPI managers can give a dashboard another owner.
Ready-made dashboards for Contacts and, when the app is installed, Sales, CRM, Inventory and Invoicing. New from Template makes an editable copy that you own.
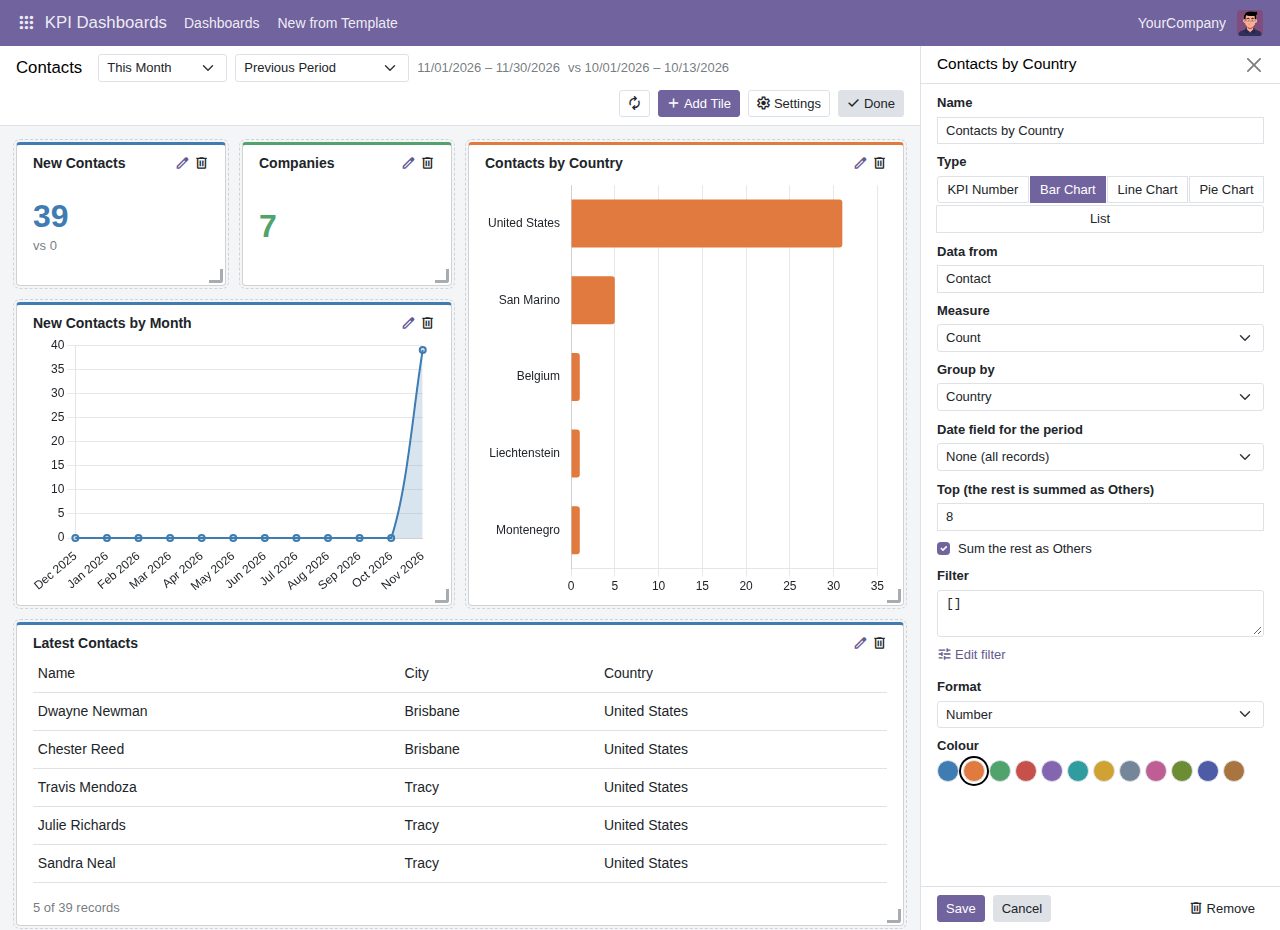
Edit mode: the tile editor beside the dashboard; drag a tile by its head and resize it by its corner
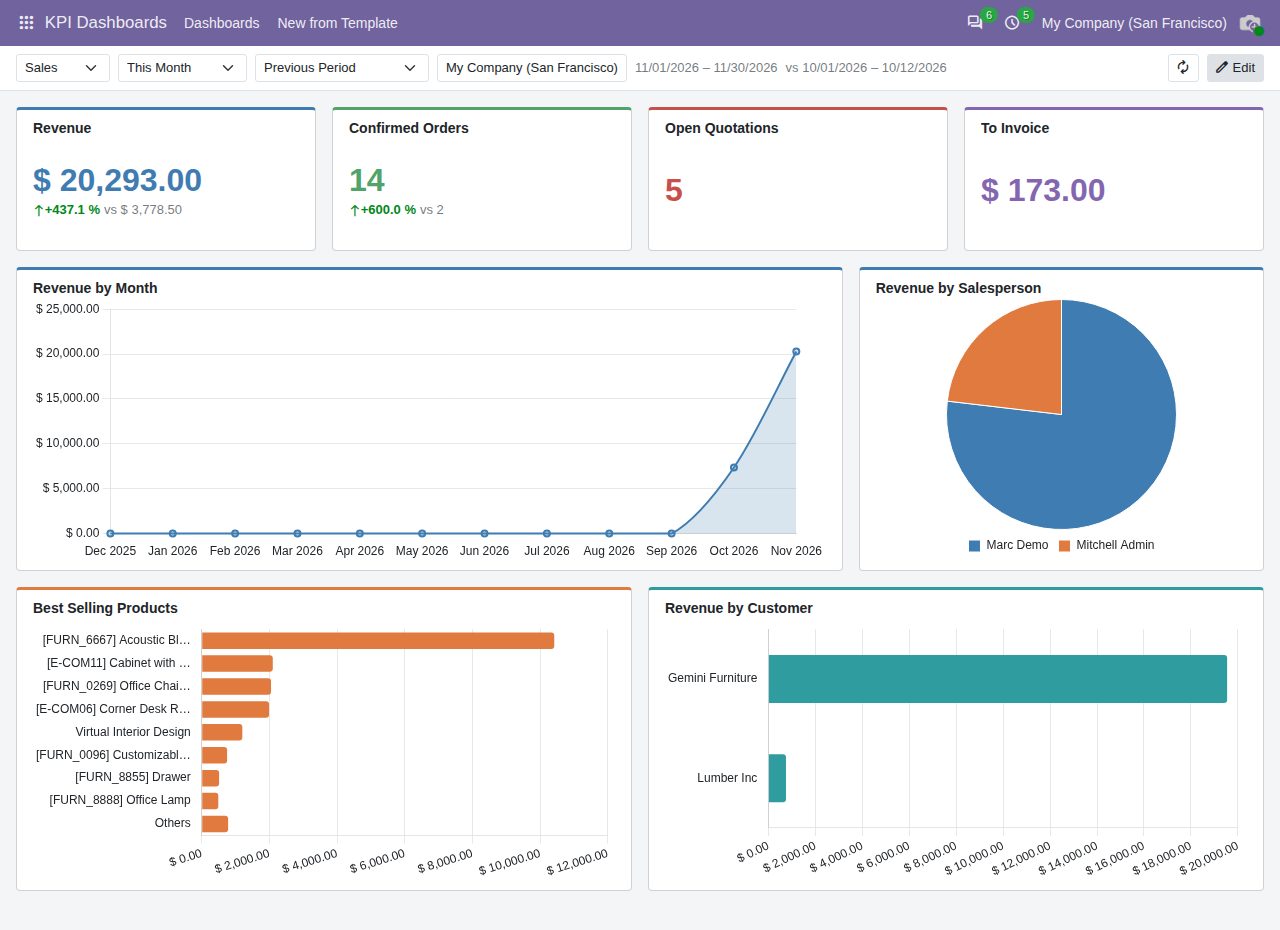
Sales dashboard: revenue against the previous period, revenue by month, salesperson, product and customer
We build custom Odoo modules and changes to this one at a fixed price, from €950 excluding VAT. Small modules are usually delivered within five working days, tested on your Odoo version. Describe what you need to hello@bizzkitt.ai.
Bitwerf is a trade name of BizzKitt B.V., Frederikstraat 67, 3034 LD Rotterdam, the Netherlands (KvK 42149345, VAT NL869932354B01). Questions: hello@bizzkitt.ai · Support · Privacy · Terms