See which products move, which tie up your money, how old your stock is, and what will run out or pile up.
Odoo tells you how much stock you have, not how well it moves. Choose a period and warehouses, and one analysis computes for every product: turnover with FSN classes, XYZ classes by stock value, stock age, out-of-stock risk with a suggested order quantity, overstock, and a movement summary from opening to closing stock.
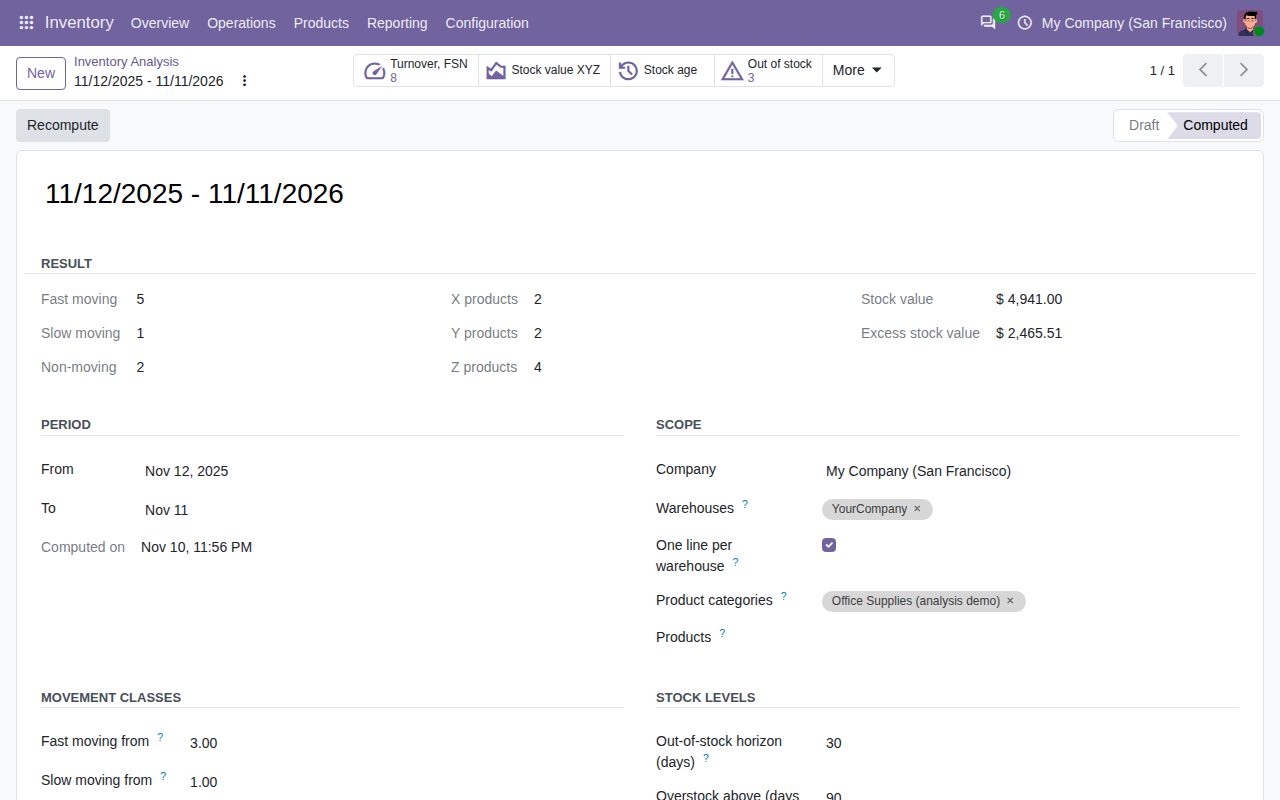
Usage (deliveries minus customer returns, plus components consumed) divided by the average stock of every day in the period. Scaled to a year, the turnover classes each product as fast moving, slow moving or non-moving, with thresholds you set per analysis.
Closing stock at cost, highest values first: X up to 70% of the value, Y up to 90%, Z for the rest. Each product shows its share of the value and a combined FSN-XYZ code, so NX marks expensive stock that does not move.
The stock at the end of the period split by receipt date, newest receipts first: 0-30, 31-60, 61-90, 91-180, 181-365 and over 365 days, with the average and the oldest age in days.
Daily usage, open receipts and open deliveries give a forecast and its days of cover. Products that run out within the horizon (30 days unless you change it), or whose forecast falls below zero, are flagged with a suggested order quantity.
Forecast stock beyond 90 days of usage (or the limit you choose) is excess, shown with its value at cost. Stock of products without usage in the period counts in full.
Opening stock, receipts, vendor returns, deliveries, customer returns, manufactured, consumed, adjustments in and out, transfers in and out, and closing stock, for any period up to today.
A line per product and warehouse, or one line per product for several warehouses, where transfers between them do not count. Narrow the analysis to product categories or products.
Every report opens as a list, pivot or graph, with filters for the FSN and XYZ classes, out-of-stock risk and overstock, and grouping by warehouse, category or class. New analyses start with your previous thresholds.
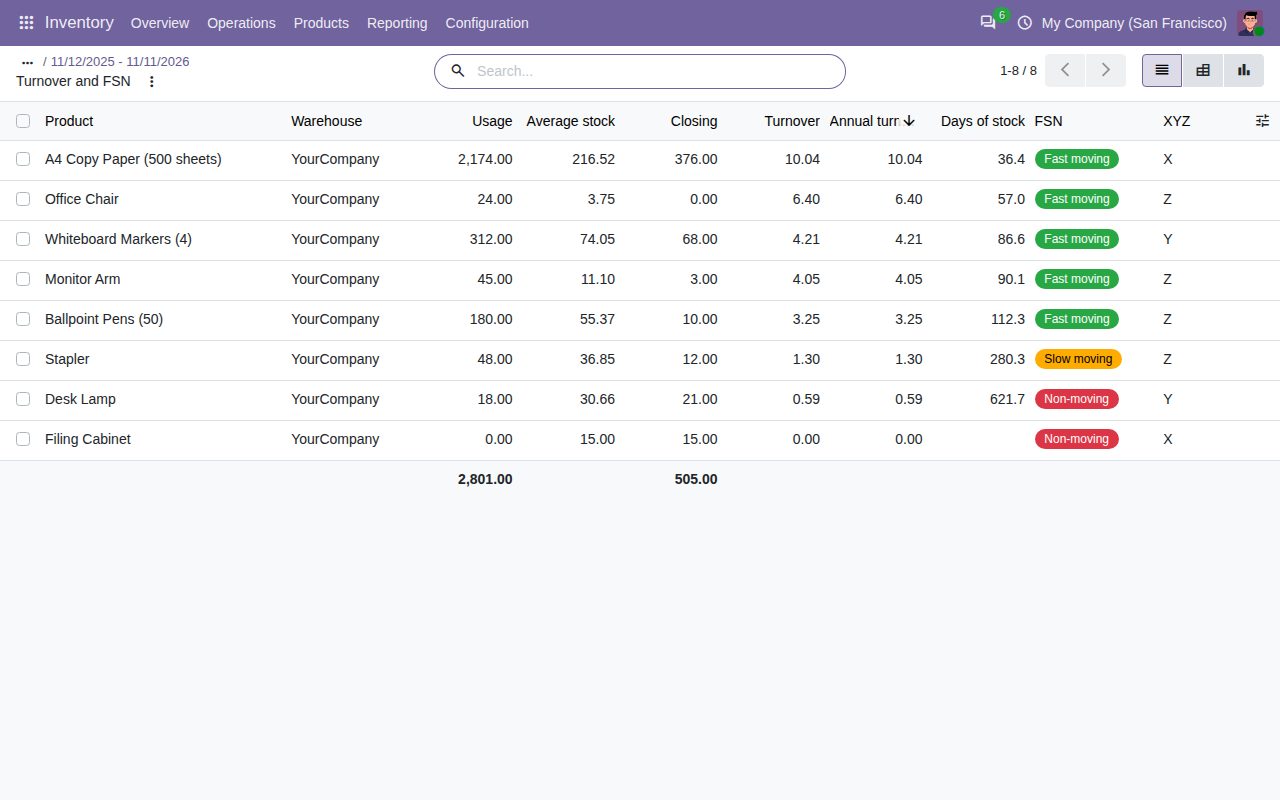
Turnover and FSN classes per product and warehouse.
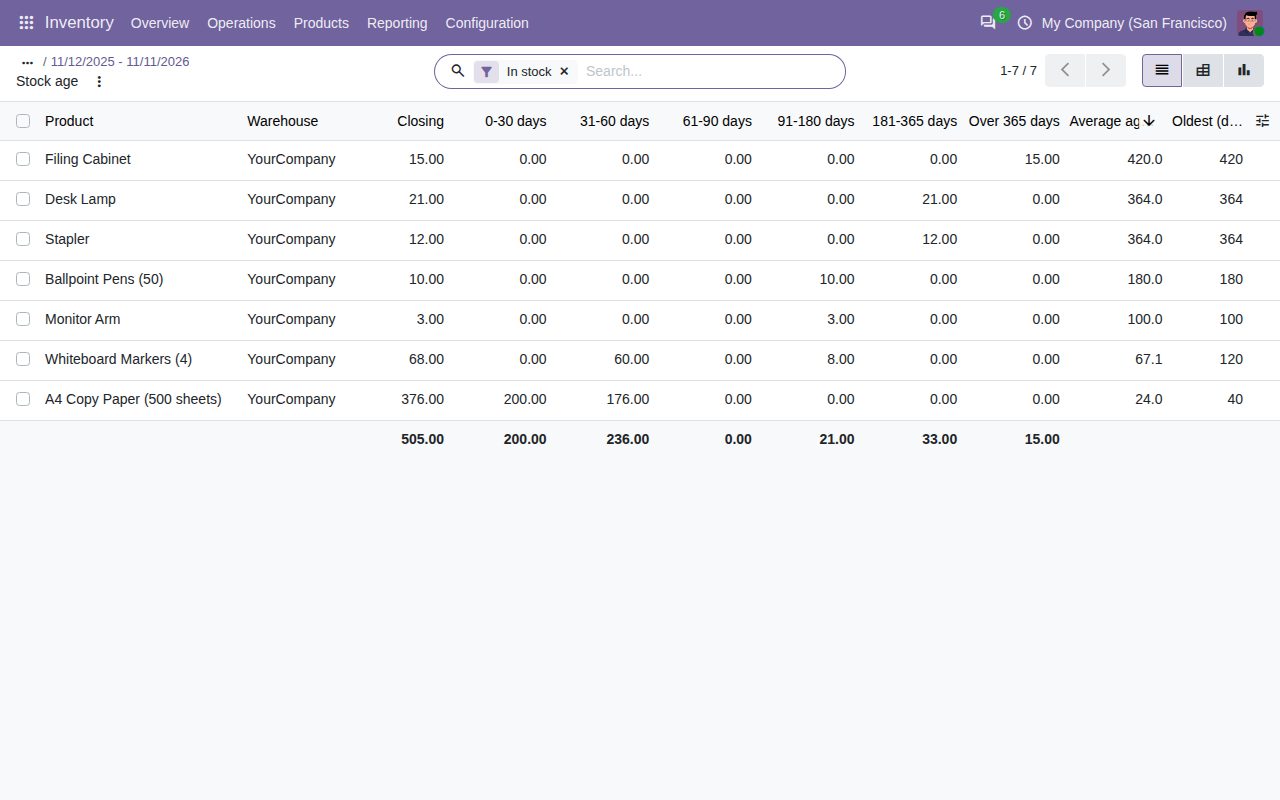
Stock age by receipt date.
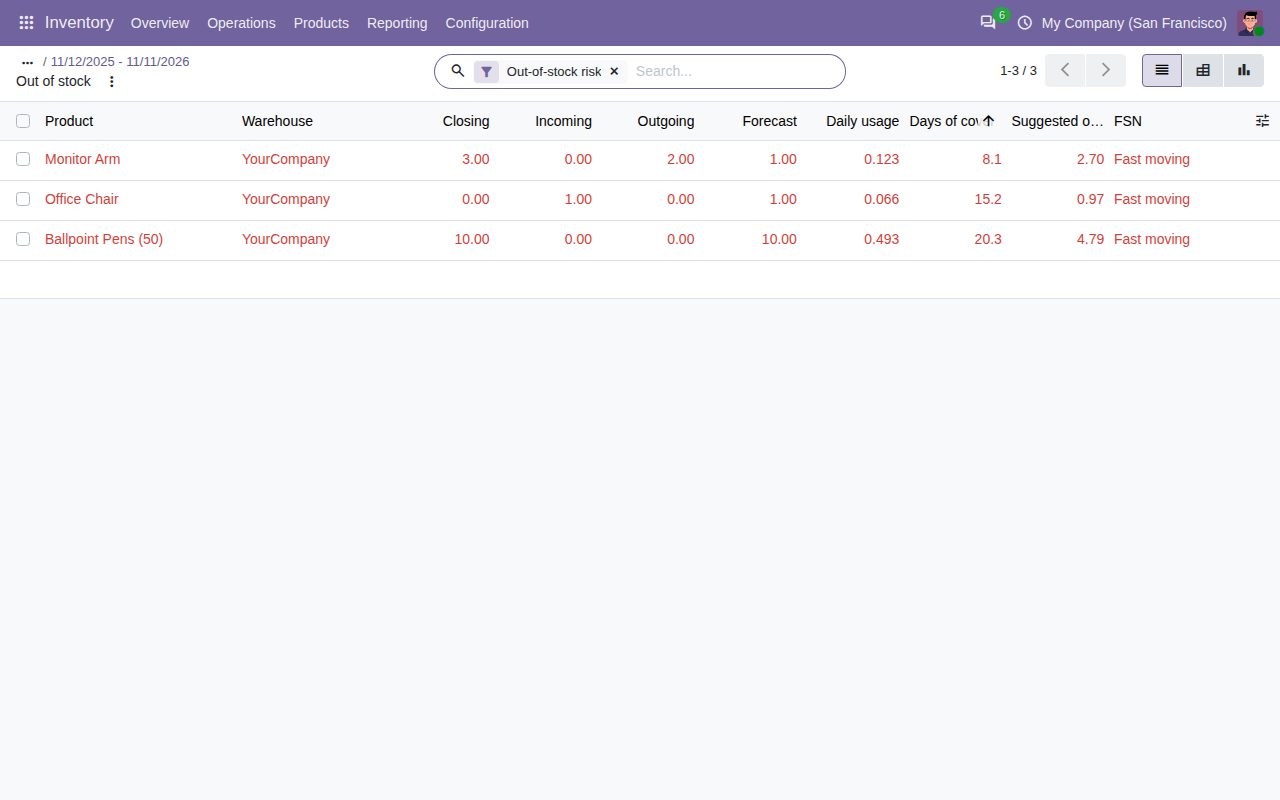
Out-of-stock risks with days of cover and a suggested order quantity.
We build custom Odoo modules and changes to this one at a fixed price, from €950 excluding VAT. Small modules are usually delivered within five working days, tested on your Odoo version. Describe what you need to hello@bizzkitt.ai.
Bitwerf is a trade name of BizzKitt B.V., Frederikstraat 67, 3034 LD Rotterdam, the Netherlands (KvK 42149345, VAT NL869932354B01). Questions: hello@bizzkitt.ai · Support · Privacy · Terms